| Cytogenetics in radiotherapy [III] |
Scenario:
Since the first observation on the induction
of chromosome aberrations in blood lymphocytes of patients received radiotherapy
by I. M. Tough, K. E. Buckton, A. G. Baikie and W. M. Court Brown in 1960
(Tough et al., Lancet, ii:849-851, 1960), lymphocyte chromosome aberration
analysis rapidly expanded in varying area of radiation cytogenetics of
humans exposed to ionizing radiation. Chromosome aberration analysis provides
not only a quantitative measure of the biological effects of radiation
in humans (IAEA Technical Report 2011; ISCN 2016) but also an important
information in establishing correct clinical management in radiotherapy
and radiation accident. Currently, estimation of dage to lymphocytes during
radiotherapy is made basing on the overall frequencies of chriomosome aberrations
leading to equivalet hole-bady dose. However, there is a limitation in
the use of such simple inference to in vitro dose-response curves because
the doses are not homogeneous. Here, we attempt an alternative biodosimetry
system, as refered to as "unforlding method", in which distribution
of chromosome aberrations are decomboluted into dose distribution profiles
(Sasaki, M. S. (2003): Int. J. Radiat. Biol., 79:83-97). The unfolding
of aberration distribution into dose distribution was tested in radiotherapy
for various degrees of dose homogeneity, loalized exposure (location and
field size) and/or inhomegeneous hit to cells by heigh LET charged perticle.
The information may be useful to the biological dosimetry in general, because
the dose is usually inhomogeneous in radiation exposure in humans, in spatial
as well as celluar aspect.
Commentary:
Currently, whole body dose during radiotherapy
has been estimated by direct comparison of aberration frequencies to the
in vitro dose-response curve. The reference dose-response curve adopted
is usually constructed based on linear-quadratic model. However, this model
can only be applied to doses below 3-5 Gy-E. Above this dose limit, the
dose-response starts to to be bent, and hence the interporated dose tend
to be under estimated. To cope with this difficulty, more generalized dose-response
curve available for doses up to 50 Gy has been proposed (Sasaki, Int. J.
Radiat. Biol., 79:83-97, 2003). The model enable direct inference to doses
up to 50 Gy ("direct inference") and also reconstruct dose distribution
profile by decombolution of aberration distribution ("unfolding").
The former have been applied to the chromosome aberration analysis in literature
(the last column of the table). However, this method does not include the
modification of aberration frequencies by cell killing. The latter method
provides equivalent whole body dose (EWBD) and dose distribution either
with or without adjustment by cell killing. The dose distribution profiles
after adjustment are presented at the end of chromosome aberration data.
The adjustment was made by lymphocyte survival, S=D/D0, in which D0=3 Gy (Edwards et al., Int. J. Radiat. Biol., 38:83-91, 1980).
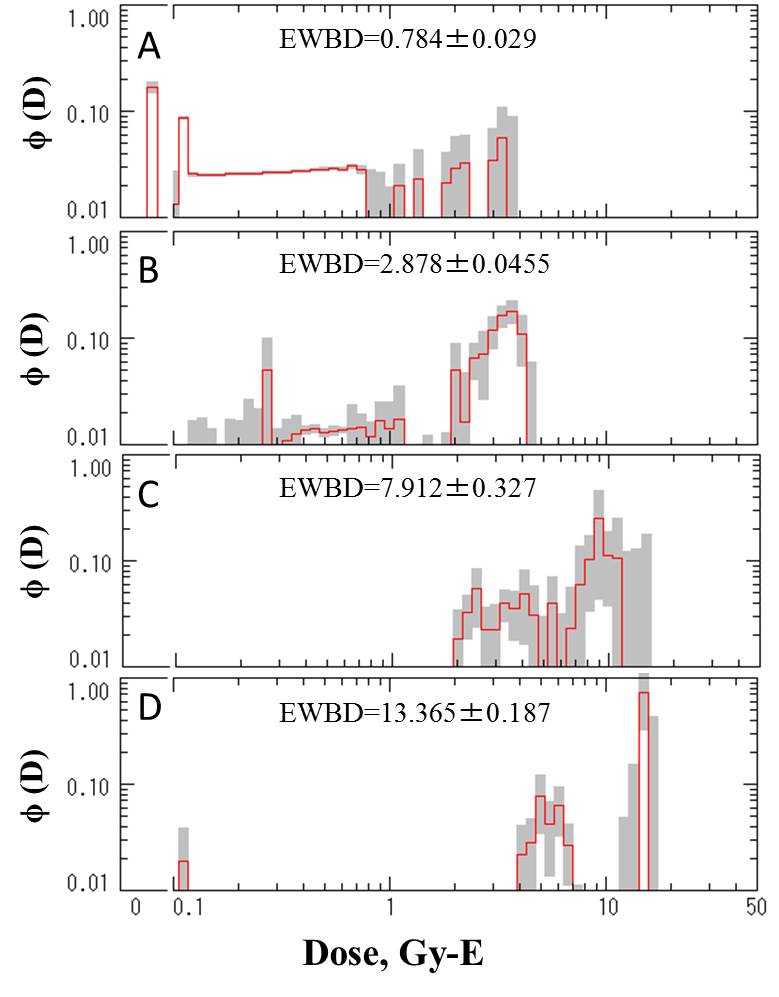
| [4] Damage to lymphocytes during radiotherapy: (a) Low LET radiation at
relatively large irradiation field |
(a) Patient with Hodgkin lymphoma treated with 15 MeV X-rays.
Reference
Diener, A., Stephan, G., Vogl, Th. and Lissner, J. (1988): The induction of chromosome aberrations during the course of radiation therapy for Morbus Hodgkin. Radiat. Res., 114:528-536.
| No. of |
Dose to tumor |
Cells |
Distribution of cells with indicated number of dicentrics |
Chromosomally estimated dose, Gy-E |
| fraction |
(Gy) |
scored |
0 |
1 |
2 |
3 |
4 |
5 |
6 |
7 |
8 |
10 |
Ave (95% CI) |
| 1 |
1.8 |
1,001 |
949 |
42 |
10 |
|
|
|
|
|
|
|
0.846 (0.664, 1.065) |
| 3 |
5.4 |
613 |
492 |
91 |
24 |
5 |
|
|
|
|
|
|
1.907 (1.625, 2.244) |
| 6 |
10.8 |
604 |
433 |
116 |
45 |
9 |
|
|
|
1 |
|
|
2.490 (2.168, 2.879) |
| 10 |
18.0 |
200 |
116 |
44 |
18 |
10 |
4 |
2 |
|
|
|
1 |
3.574 (3.081, 4.156) |
| 12 |
21.6 |
200 |
89 |
58 |
21 |
17 |
6 |
1 |
1 |
1 |
|
|
4.240 (3.702, 4.880) |
| 21 |
37.8 |
400 |
221 |
65 |
54 |
26 |
7 |
4 |
4 |
3 |
1 |
1 |
4.075 (3.621, 4.623) |
|
 |
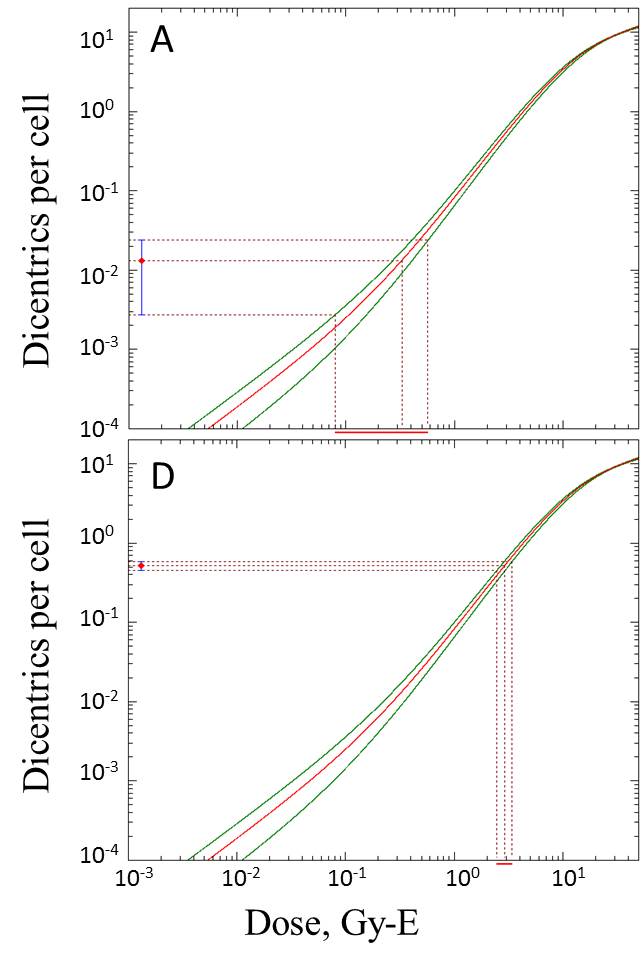
| Dose profiles: A: one fraction 1. B: 6 fractions. C: 12 fractions. D: 21 fractions. The
dose distributions have been adjusted by lymphocyte survival. |
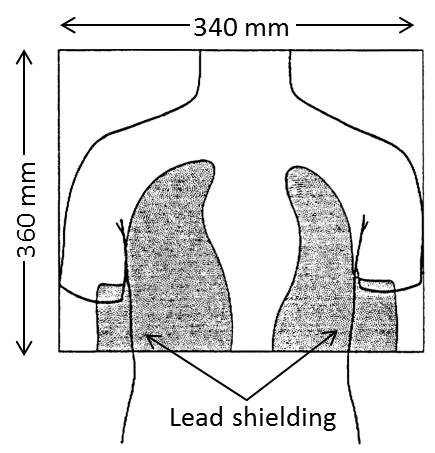
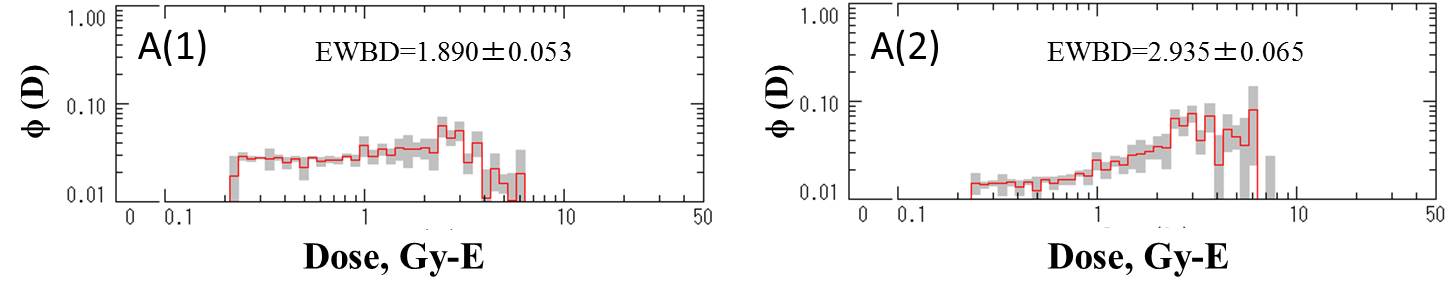
| [5] Damage to lymphocytes during radiotherapy: (b) Low LET radiation at
relatively large irradiation field |
(b) Relatively large irradiation field: Breast cancer patients (9 patients)
treated with 60Co gamma-rays.
Reference
Rigaud, O., Guedeney, G., Duranton, I., Leroy,
A., Doloy, M. T. and Magdelenat, H. (1990): Genetoxic effects of radiotherapy
and chemotherapy on the circulating lymphocytes of breast cancer patients.
I. Chromosome aberrations induced in vivo. Mutation Res., 242:17-23.
| No. of |
Dose to tumor |
Cells |
Distribution of cells with indicated number of dicentrics |
Chromosomally estimated dose, Gy-E |
| fraction |
(Gy) |
scored |
0 |
1 |
2 |
3 |
4 |
5 |
6 |
Ave (95% CI) |
| 30 |
54.0 |
1,466 |
1,127 |
232 |
71 |
24 |
9 |
2 |
1 |
2.272 (2.009, 2.594) |
| Dose profiles: A(1) 30 fractions (dose profile with no adjustment by lymphocyte survival.
A(2): 30 fractions (dose profile with adjustment by lymphocyte survival.. |
| [6] Damage to lymphocytes during radiotherapy: (c) Low LET radiation at
relatively small irradiation field |
(c) Relatively small irradiation field: Cervical cancer patients (29 patients)
treated with 60Co gamma-rays.
Reference
Venkatachalam, P., Paul Solomon, F. D., Karthikeya
Prabhu, B., Monhankumar, M. N., Gajendiran, N. and Jeevanram, R. K. (1999):
Estimation of dose in cancer patients treated with fractionated radiotherapy
using translocation, dicentrics and micronuclei frequency in peripheral
blood lymphocytes. Mutation Res., 429:1-12.
| No. of |
Dose to tumor |
No. of |
Cells |
Distribution of cells with indicated number of dicentrics |
Chromosomally estimated dose, Gy-E |
| fraction |
(Gy) |
subjects |
scored |
0 |
1 |
2 |
3 |
4 |
5 |
6 |
7 |
8 |
&rt;10 |
Ave (95% CI) |
| 1 |
2 |
1 |
226 |
223 |
3 |
|
|
|
|
|
|
|
|
0.328 (0.080, 0.571) |
| 2 |
4 |
2 |
426 |
409 |
13 |
4 |
|
|
|
|
|
|
|
0.739 (0.517, 0.993) |
| 3 |
6 |
2 |
478 |
461 |
15 |
1 |
1 |
|
|
|
|
|
|
0.670 (0.462, 0.909) |
| 4 |
8 |
4 |
1076 |
999 |
63 |
12 |
2 |
|
|
|
|
|
|
1.029 (0.836, 1.261) |
| 6 |
12 |
2 |
425 |
388 |
32 |
4 |
1 |
|
|
|
|
|
|
1.127 (0.876, 1.419) |
| 7 |
14 |
3 |
550 |
481 |
51 |
15 |
3 |
|
|
|
|
|
|
1.489 (1.229, 1.797) |
| 8 |
16 |
2 |
203 |
185 |
11 |
5 |
2 |
|
|
|
|
|
|
1.321 (0.991, 1.692) |
| 9 |
18 |
2 |
423 |
331 |
55 |
23 |
8 |
3 |
2 |
|
|
|
1 |
2.392 (2.053, 2.797) |
| 21 |
42 |
2 |
185 |
123 |
37 |
16 |
7 |
2 |
|
|
|
|
|
2.949 (2.491, 3.485) |
| 22 |
44 |
2 |
213 |
169 |
28 |
10 |
3 |
3 |
|
|
|
|
|
2.210 (1.821, 2.662) |
| 27 |
54 |
2 |
225 |
157 |
35 |
20 |
11 |
2 |
|
|
|
|
|
2.902 (2.450, 3.411) |
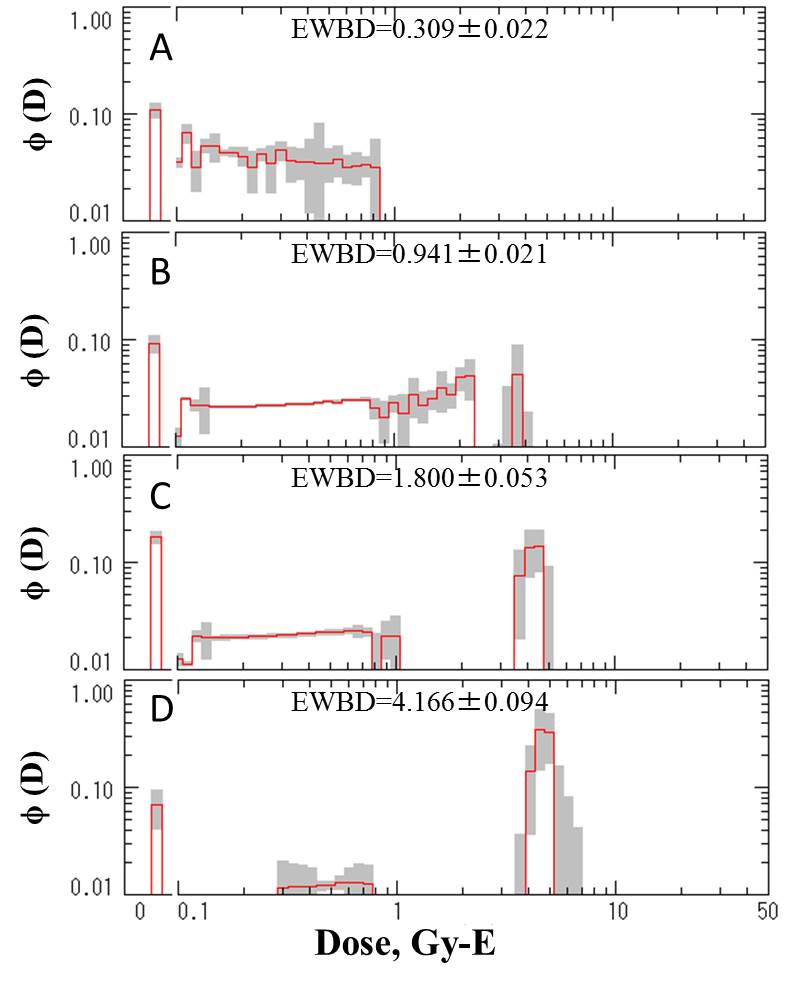
| Dose profiles and direct inference: A: one fraction. B: 4 fraction. C: 8 fractions. D: 27 fractions. The dose
profiles are those adjustment by lymphocyte survival. |
| [7] Damage to lymphocytes during radiotherapy: (d) High LET radiation at
relatively small irradiation field |
(4)
Relatively localized irradiation field: Cervical cancer patients (8 patients)
treated with carbon ion beams (350-400 MeV) at HIMAC. Treatment consisted of a
fixed total number of fractions and treatment time of 24 fractions over 6 weeks
with 4 fractions per week. The treatment covered cervical tumor and pelvis lymph
nodes. The initial fraction was 2.2 Gy-E, which was followed by progressive
increase of dose per fraction, giving a total dose of 52.8 Gy-E to 72.8 Gy-E
(see, Nakano et al. Clin. Cancer Res., 12:2185-2190, 2006).
Reference
Unpublished data. Data scored by I. Hayata (National Institute of Radiological
Sciences, Chiba) and M. S. Sasaki (Radiation Biology Center, Kyoto University,
Kyoto).
| No. of |
Dose to tumor |
Cells |
Distribution of cells with indicated number of dicentrics |
Chromosomally estimated dose, Gy-E |
| fraction |
(Gy) |
scored |
0 |
1 |
2 |
3 |
4 |
5 |
6 |
Ave (95% CI) |
| 1 |
2.2 |
1,200 |
1,165 |
23 |
8 |
3 |
1 |
2 |
1 |
0.803 (0.632, 1.010) |
| end |
54.6 (52.8-62.4) |
771 |
534 |
104 |
73 |
35 |
12 |
5 |
8 |
3.231 (2.877, 3.661) |
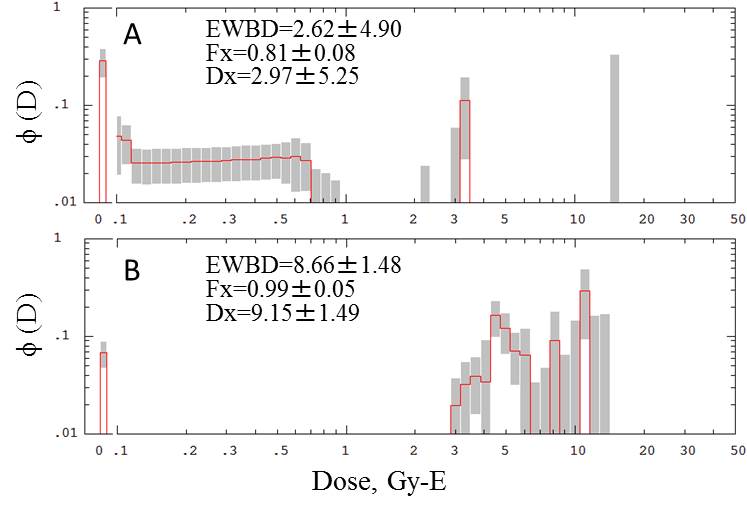
Dose profiles:A: one fraction. B: end of treatment. EWBD: equivalent whole body dose (Gy-E). Fx: exposed fraction. Dx: dose to the exposed fraction.
Dose profiles after adjustment by lymphocyte survival. |